Lorem ipsum dolor sit amet consectetur. Non mauris at at ullamcorper enim mauris massa. Et id arcu placerat facilisis. Aliquam in eget velit faucibus nunc cras aliquam. Tellus nunc viverra imperdiet convallis laoreet lacus placerat mauris et.Cras massa rutrum bibendum pellentesque platea id.
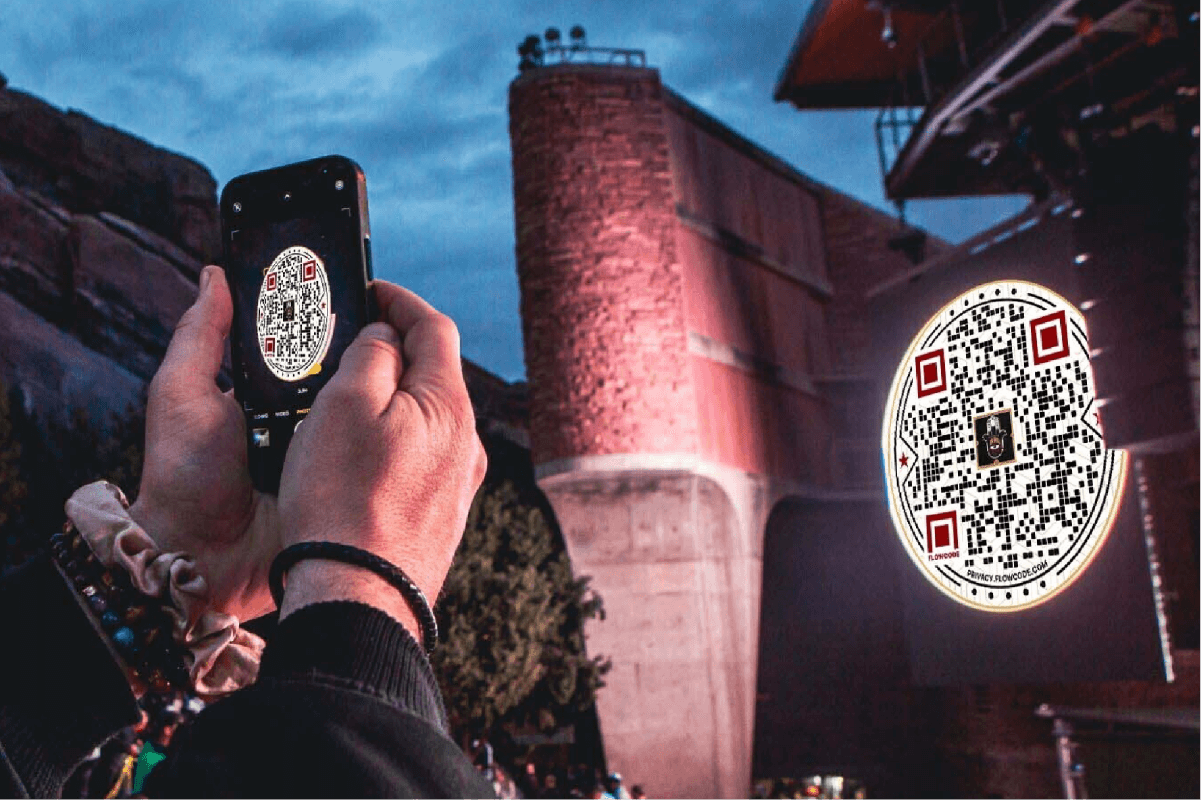
The Flowcode Analytics portal, also known as “Flowlytics”, powers instant insights in real-time. This real time analytics dashboard allows you to view the engagement with all your Flowcode products. Here, you can gather scan data on a Flowcode QR code you created, or find click-through rates from your Flowpage (link landing page) you’ve shared on social media.
Flowlytics will become your data hub, enabling you to explore and parse through data on one seamless dashboard. This tool is created to uniquely power you to understand how customers are interacting with your offline marketing, measure the success of your QR codes and pages, and even track robust marketing campaigns.
Keep reading for details on how to navigate the Flowcode analytics portal.
How do I navigate the analytics portal?
When you’re logged into your Flowcode account, navigate to the left hand toolbar and select “Analytics”. From there, you can decide if you’d like to look at analytics for your Flowcodes or Flowpages by toggling between the two options.
Within the respective dashboards, you can view the analytics for the broader activity of impressions across all your codes and pages, or decide to focus on activity for specific Flowcodes or Flowpages by selecting "Filter"and the name of your code or page that you added to them during the creation process.
Analytics for Flowcodes
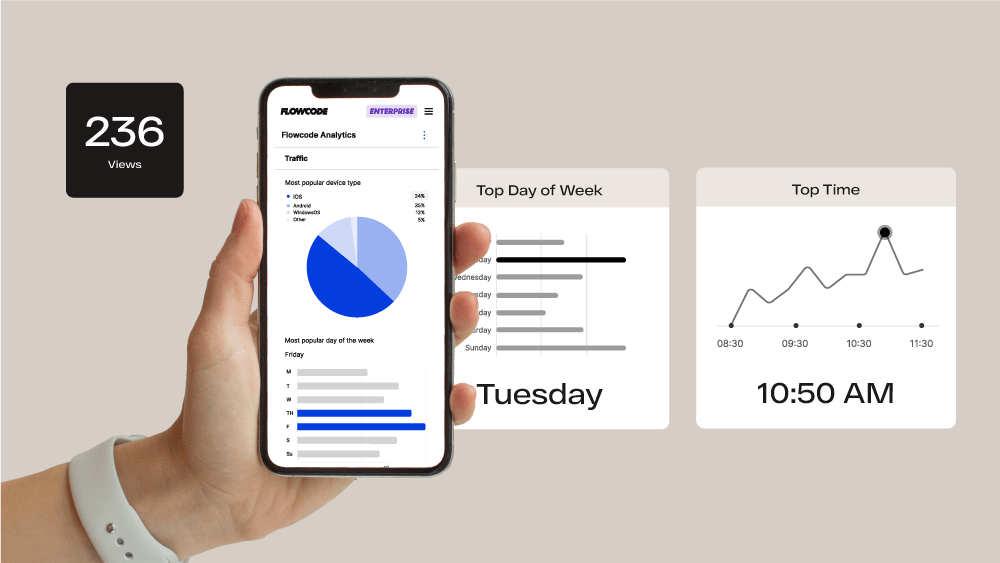
Let’s say you selected“Analytics”then“Flowcode”. Now you’re on your Flowcode data dashboard. You'll notice at the top of the page it breaks down scan data by day, week, month, and the last 90 days. These tools are available to all users, including those using our Basic plan.
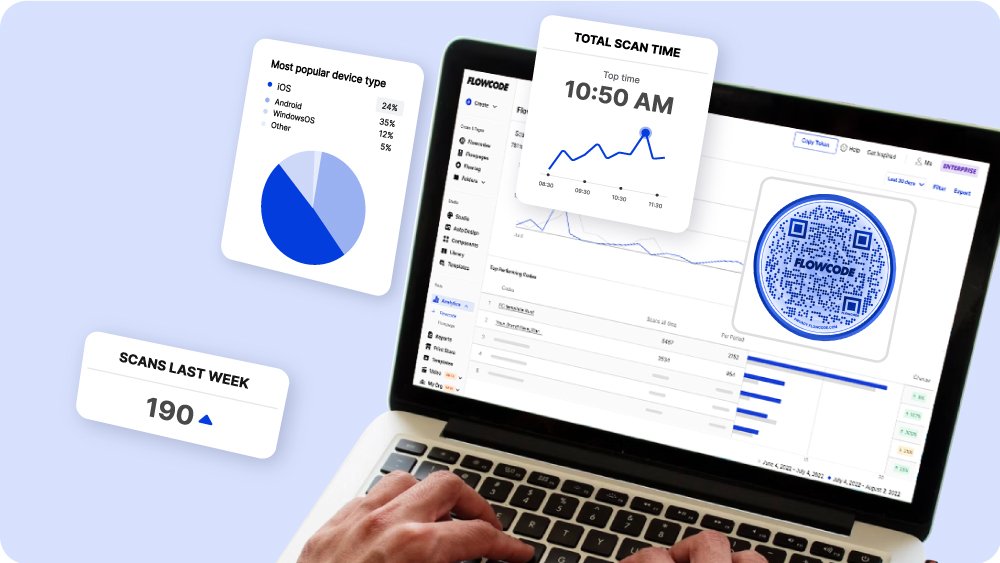
By leveraging the filter functionality on the top right hand corner, you can view a side-by-side analysis of your Flowcodes or any tags applied to your Flowcodes. A side by side analysis of codes of top performing codes and tags can viewed in their respective dashboards as seen here. Side-by-side comparisons are an effective way to measure marketing attribution, which is the practice of evaluating which Flowcode’s a consumer encounters on their path to make purchase or land on your website, for example.
If you upgrade to paid features, you can access additional features such as:
Interactions by date, day of week, and even the time of day
Device type and location
Bulk code creation for household level data
Advanced geo-location tracking
Advanced exporting and sharing
Custom pixel re-targetting
Each of these datapoints provide a valuable window into your customer base, starting with how and when customers are engaging with your content.
Analytics for Flowpages
Now we'll cover how to navigate the Flowpage analytics dashboard. To access this page, select“Analytics”then“Flowpage”.
Here, you'll get access to similar data as Flowcode QR codes, but instead of scans, you can view landing page sessions and link clicks. Sessions measures how many times your Flowpage is visited, whereas link clicks measure how much engagement each link on your Flowpage receives. Similarly, you can filter between your respective Flowpages to track engagement across different users in your organization, or different pages you've created for different campaigns.
With advanced and paid features, you can gather even more in-depth data such as:
Interactions by date, day of week, and even the time of day
Top performing links
UTM source tracking
Referrals tracking
Custom pixel retargetting
By using advanced features for Flowpages, you unlock deeper insight into a customer's journey and can track their entire interaction with your brand from acquisition to conversion when you use UTMs and pixel tracking.
How can I stay up to date on my analytics?
Flowcode analytics always populate in real time, meaning you get scans updated instantaneously. You'll have access to Flowlytics 365 days of the year, so you can check in with your campaigns and performance on your own time.
Need to export the data? The export functionality allows you to download the dashboard as a PDF file or as a CSV to view the data at a granular level.
At paid tiers, you have access to even further exporting integrations, as well as Flowcode Reports sent directly to your inbox by the Flowcode team.
Flowcode Analytics makes it easy to understand how your Flowcodes and Flowpages are performing in the real world, and provides feedback instantly. Simply use the Flowlytics page to explore the performance of your different codes and pages, filter searches to suit your needs, track specific campaigns with geo-location and UTMs, and export data in a simple dashboard to communicate performance with your team!
Implementing QR Codes in Low-Connectivity Environments
Flowcode's advanced geolocation data map enables users to identify the exact location consumers are scanning QR codes. Customers can access precise demographic data...
QR code scams are skyrocketing — discover how Flowcode is keeping brands safe
Flowcode's advanced geolocation data map enables users to identify the exact location consumers are scanning QR codes. Customers can access precise demographic data...
From pandemic essentials to the new normal: How QR codes rose to prominence
Flowcode's advanced geolocation data map enables users to identify the exact location consumers are scanning QR codes. Customers can access precise demographic data...


.webp)